
.png?height=200&name=MongoDB%20(2).png)
Export your MongoDB data with Apache Hop. Streamline your data export process and enhance...
In this tutorial, we'll explore how to utilize the Apache Hop “Row Denormalizer” transform.

The "Row denormalizer" transform enables you to denormalize data by referencing key-value pairs, with the added flexibility to convert data types during the process.
What will you find here?
Use case scenario
Let's consider a scenario where we have films listed in one column, along with their respective years, quarters, and the revenue generated.
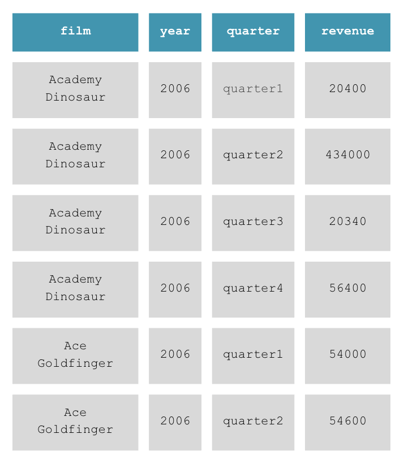
Notice that each quarter is a row in the column quarter.

We need to restructure the revenue data based on quarters for each film. We need to convert the data from this format:
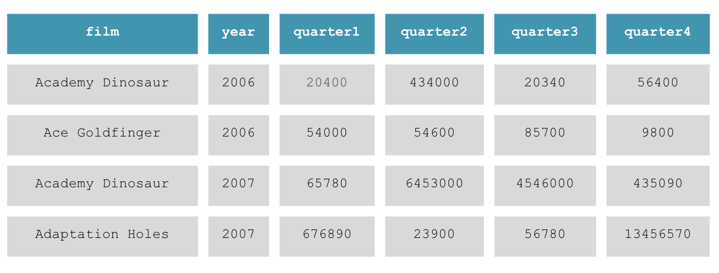
To this format:
To accomplish this, we can use the "Row denormalizer" transform to convert each quarter on a column.
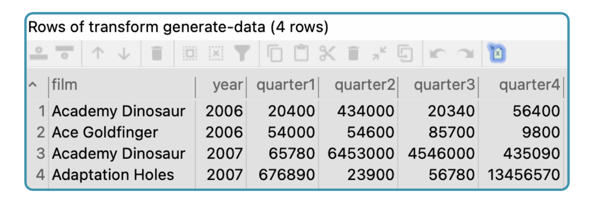
The data has been generated using a data grid.

While we've demonstrated this with a simplified example, it's important to note that the data source can be in any format, such as Excel, tables, etc.
To begin, we'll cover the steps involved in this use case scenario:
Step 1: Add and connect the "Row denormalizer" transform.

Step 2: Configure the "Row denormalizer" transform:

- Transform name: Define a transform name (denormalize-rows).
- Type key field: Choose the key field that serves as the source field for denormalization based on its values (quarter).
- Group field: Then, in the Group field section, keep the source fields to be used for grouping and remove the rest (film and year).
- Target fieldname: Specify the name of the quarter columns that will be generated (quarter1, quarter2, quarter3, and quarter4).
- Value fieldname: select the column that contains the amount corresponding to the quarter key values (revenue).
- Key values: Specify the source key values to be user for denormalization (quarter1, quarter2, quarter3, and quarter4)
💡 Please, note that we maintain the "Target fieldnames" with the same "Key values" as quarter1, quarter2, quarter3, and quarter4 respectively but you can choose a different name for the columns to be generated.
However, we're overlooking a crucial step.
Upon clicking "OK" to save, a message appears, indicating that if the data is not sorted, the denormalized results may be incorrect. Therefore, it is necessary to sort the data before proceeding with denormalization.
We add and connect a Sort Rows transform, then configure it by providing a name and fetching the fields from the previous transform.

Then, we configure it by providing a name and fetching the fields from the previous transform.

- Transform name: Specify the name of the transform, this name has to be unique in the pipeline (sorting).
- Fields: Use the "Get Fields" option to retrieve all the fields from the previous transform (film, year, quarter and revenue).
By previewing the denormalize-rows transform, you'll see the transformed data, achieving the desired output format.
After denormalization, you can export the dataset to different formats based on your requirements.
But in our simplified example, that concludes the process! We've effectively transformed the data in the datagrid into a denormalized format.

How it works
In summary, how we did it❓
-
We created a pipeline and mapped the input data using a denormalizer.

-
The key field was set as the "quarter" column in the source.

-
We grouped the revenue per quarter using "film" and "year", resulting in a revenue entry for each film, year, and quarter.

-
The target fieldname represents the new columns to be created, generating a column for each quarter value.

-
The value field name indicates the revenue value.

Finally, the key value corresponds to the quarter number for each distinct value in the "quarter" column.

The result is the denormalized output:
Not covered in this post
We haven't explored all the options available in the Target fields table within the "Row denormalizer" transform.
For example, in the following example, we only group by film, and select "Number of Values" as the "Aggregation" method.

Upon previewing the "Row denormalizer" transform, we obtain the following results:
Instead of displaying the revenue value, the output now indicates how many revenue values each film has per year and quarter. For example, the film "Academy Dinosaur" has 2 years in the input dataset.
💡 Notice that, in this case, the year value is not correct because we only grouped by film.
Apart from the aggregation method, you can explore the other options in the "Target fields" table we didn't cover in this post:
- Format
- Length
- Precision
- Currency
- Decimal
- Group
- Null if
Summary
- Understand the purpose: The "Row denormalizer" transform in Apache Hop is designed to revert standardized data back to its original pivot or denormalized table structure by converting rows into columns.
- Consider your data structure: Before using the "Row denormalizer," assess whether your data needs restructuring, especially if it involves pivot-like structures.
- Utilize the right fields: When configuring the transform, select the appropriate fields from your dataset, ensuring you include those relevant to the denormalization process.
- Preview before finalizing: Always preview the transformation results to ensure they align with your expectations and requirements.
- Export options: Once the denormalization process is complete, you can export the transformed dataset to various target formats, catering to your specific needs and preferences
-2.png?height=200&name=Featured%20images%20(3)-2.png)
-3.png?height=200&name=Featured%20images%20(3)-3.png)